Social Network Analysis
Be sure to read this specification in its entirety before starting so you know what to do and how to do it!
This weeks problem set is a group work task. You are going to group teams individually with up to 3 people. Every group member should contribute to solve the problem set and write some of the submission code, since it is relevant for the exam anyhow.
Collaboration between groups is not allowed, except to the extent that you can ask classmates and others for help, as long as that help does not amount to having someone else do your work for you, as per the course’s academic honesty policy. The staff conducts random audits of submissions. Students found to be in violation of this policy will be removed from the grade improvement.
Networks are omnipresent in our increasingly connected world. We use logistical networks to determine the fastest way from A to B, social networks to interact with friends, or Wide Area Networks like the Internet in many areas of daily life such as communication, entertainment, shopping, education, etc.
Network theory has emerged in science to capture, describe and explore these and many other phenomena of our time. It is used in various disciplines such as sociology, psychology, healthcare, neuroscience, as well as almost all natural sciences where it is part of graph theory.
Computer science is a special field of application because it can support many other disciplines through digital network representations in computationally intensive analyses. Network theory is therefore an interdisciplinary interface for us, allowing us to apply our previously acquired IntroCS knowledge to a new field of research. In this assignment, we want to specifically deal with social network analysis, a subfield of sociology. SNA provides us with tools to decipher and visualize relationships and information flows between people, groups, organizations, or other networked units. It can provide answers to exciting questions such as:
- “How polarized is a voter network?”
- “How fragmented is a consumer network?”
- “How do people’s world views might differ as a consequence of what they see, read, and hear in their feeds?”
- “What assumptions about a city’s culture and social composition can we infer by comparing networks from people living in different locations?”
These insights from sociology, psychology, economics, and society can help us to view the world in a more nuanced way and to make progressive decisions based on it.
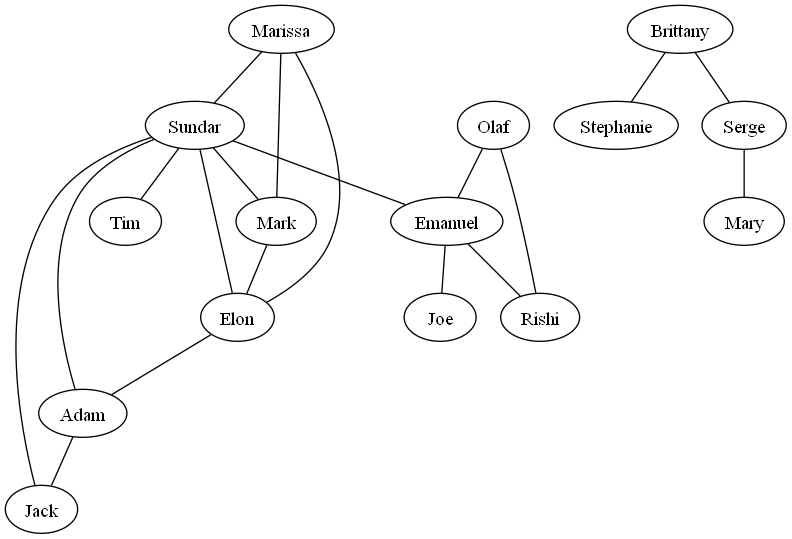
In this problem set, you will implement a graph representing a personal network of a Mastodon user. While exercises are described based on an artificial example (displayed below) you will directly apply your implementation to real world data from the Mastodon API. Based on the established Graph and algorithms we will be able to conduct a social network analysis which answers questions about a network. In our graph, a vertex represents a user located at that relative position in the network. As edges we depict connections between user. Notice that for simplicity reasons we opted for an undirected graph where there exist a connection if one of the two vertices spanning the edge follows the other. Furthermore the network might be a disconnected graph which means that the network comprises multiple sub-networks without a connection between them. A disconnected graph is likely in real world data as you probably also have a facebook friend that is not befriended with any of your other friends. Therefore, the program you will write can build networks that are not interconnected to one another.
- Getting Started
- Group work
- Specification
- 1. Graph implementation
- 2. Network Connectivity (Depht-First-Search)
- 3. Shortest path (Breadth-First-Search)
- 4. Most influential users (Closeness)
- 5. Community detection (Betweenness)
- check50
- submit50
Getting Started
Log into the CS50 IDE and then, in a terminal window, execute each of the below
- Execute
cdto ensure that you’re in~/(i.e., your home directory). - Execute
mkdir Graphs_Treesto make (i.e., create) a directory calledGraphs_Treesin your home directory. - Execute
cd Graphs_Treesto change into that directory - Execute
wget https://introcs.is.rw.fau.de/assets/pdfs/mastodon_network.zipto download a (compressed) ZIP file with this problem’s distribution. - Execute
unzip mastodon_network.zipto uncompress that file. - Execute
rm mastodon_network.zipfollowed byyesoryto delete that ZIP file. - Execute
ls. You should see this problem’s distribution:graph.py, network_analysis.py, group_members.txt and a ressources directory - In order to run the
network_analysis.pyfile you will have to execute the following command first in your command line:sudo apt-get install graphviz. If this wasn’t sufficient, try runningsudo apt updateand `sudo apt upgrade’ first.
You only have to code in graph.py. Do not change anything in the directory ressources. You can use network_analysis.py to test and debug your graph.py implementation on a real dataset.
Group work
To indentify the team you have formed for this weeks problem set, please fill out the .txt-file with the GitHub usernames of every member. Make sure to not forget this step, since you and your teammates will submit the exact same code. If you don’t submit your group members correctly, we are not able to give you a point for this problem set, since it would be plagiarism.
For this week you need to submit both mastodon_sna and mastodon_bst as a group and achieve at least 80% of test and style scores in each.
The size of the group should not exceed 3 people. However, if you want to solve the task with only 2 people or alone, you are welcome to do so. But please be aware that we still expect you to solve the task 80% functionally and 80% stylistically.
Collaboration between groups is not allowed, except to the extent that you can ask classmates and others for help, as long as that help does not amount to having someone else do your work for you, as per the course’s academic honesty policy.
Specification
To give you a brief overview of how we were hoping you could implement the Pythonic graph, let us look at the data structure you should use.
Notice that our provided class Graph in graph.py inherits the properties of a dictionary (dict). As a result, when you have implemented your network correctly, your representation should be a dictionary that somewhat looks like this:
{'Marissa': ['Elon', 'Mark', 'Sundar'], 'Sundar': ['Adam', 'Elon', 'Emanuel', 'Jack', 'Marissa', 'Mark', 'Tim'], 'Mark': ['Elon', 'Marissa', 'Sundar'], 'Elon': ['Adam', 'Marissa', 'Mark', 'Sundar'], 'Brittany': ['Serge', 'Stephanie'], 'Stephanie': ['Brittany'], 'Adam': ['Elon', 'Jack', 'Sundar'], 'Jack': ['Adam', 'Sundar'], 'Tim': ['Sundar'], 'Serge': ['Brittany', 'Mary'], 'Olaf': ['Emanuel', 'Rishi'], 'Emanuel': ['Joe', 'Olaf', 'Rishi', 'Sundar'], 'Rishi': ['Emanuel', 'Olaf'], 'Joe': ['Emanuel'], 'Mary': ['Serge']}
Notice that every vertex is a key in the dictionary mapped to a list of followers representing the edges.
Be aware that you can not change anything about the parameters and arguments a method can take.
We divided this exercise into 5 separate logical chapters which together require the implementation of 12 methods in total. Notice that 2 auxiliary methods are already given to you.
- parse_data(): parses real world data from Mastodon to your graph implementation
- show(): uses the graphviz library to visualizes your graph by creating a png-file. You can always execute this method to check the current state of your graph.
Let us now start with the first chapter…
1. Graph implementation
add_vertex()
Adds a vertex to the dictionary. Notice, the method only takes one argument, a key. This key is an object of the class User for our vertex in our network, i.e. the user Mark. When creating an object of type Graph, you create a dictionary, as you can see from the class constructor. Thus, you will have to insert every vertex of the network as a key to your dictionary. The element mapped to every key/vertex in your dictionary is an empty list. Later, the neighbors can then be added to those lists. For instance, if we added Mark, the graph vertex that we add to our graph with this method would look like this:
{Mark : []}
Hint: This is straight forward; the best implementation requires you to write a single line of code. To store an object as a key in the dictionary cast it as a string.
add_edge()
We need this method to depict the connections between our users, i.e. the vertices in our network, as edges. This method takes two parameters. Firstly, ‘origin’, which is the vertex to that we add the edge. Secondly, ‘target’ is the vertex that the edge leads to from ‘origin’. Looking at the connection between Sundar and Adam in our network, the internal representation of the graph should look like this:
{Sundar : [Adam], Adam : [Sundar]}
When creating an edge in the method, both vertices that the edge belongs to must be added to or exist in the graph dictionary. Be careful! Since our network is an undirected graph, every edge goes both ways. This means that there exist a connection if only one of the two users follows the other. Thus, if we have Adam as the origin and Sundar as the target, the connection also exists vice versa. Sundar can be the origin with Adam as the target. Important: You should sort your edges alphabetically when adding them to a vertex.
remove_edge()
We need this method to delete the connections between our users, i.e. the vertices in our network. This method will play a significant role when we detect communities in our network. This method should be designed analogous to the add_edge() funtion. It receives two parameters while the order of the parameters does not matter.
remove_vertex()
Like for edges we also need a method that removes a vertex from the graph. Make sure to handle all its edges that still exist with this vertex accordingly.
Hint: You can now check the correct implementation of the add- and remove-functions by using the check50 command in your terminal:
check50 fau-is/IntroCS/Mastodon_GT/Mastodon_network
With these four methods we are now able to populate the graph with our provided network in the json format. Exercise 1.1 in network_analysis.py should run properly and generate a png file of the Mastodon network.
2. Network Connectivity (Depht-First-Search)
dfs()
When we create a network we want to be able to traverse our graph and discover all other vertices that can be reached when we start at a defined vertex. For this purpose we can use a (pre-order) depth-first search. Therefore, the method dfs() takes one argument ‘start’. You will now have to write the pre-order depth-first search algorithm that traverses the network in a pre-order fashion, starting at your ‘start’ point and storing the correct path in a list of visited vertices, returning it at the end of the method.
For our example, if we started our pre-order DFS at Mark, the returned list ‘vertex’ should look like this:
['Mark', 'Elon', 'Adam', 'Jack', 'Sundar', 'Emanuel', 'Joe', 'Olaf', 'Rishi', 'Marissa', 'Tim']
Sub-Networks: Identifying Disconnected Clusters
In this section, your task is to use the Depth-First Search (DFS) algorithm to figure out how many separate “sub-networks” or clusters are in our graph. These sub-networks represent groups of vertices that are connected to each other but not to vertices in other sub-networks. This is important in understanding whether a Mastodon user’s network forms one large interconnected community or consists of several smaller, isolated groups.
Your task is to write the get_subgraphs() method. This method should identify and return all the disconnected clusters within the graph. Each cluster (or sub-network) is represented as a list of vertices that are connected to each other. If the graph is fully connected (meaning there are no isolated clusters), your method should return a list containing just one item, which is a list of all vertices in the graph.
To achieve this, you’ll first need to implement a DFS method as described earlier. Then, using this DFS method, you can explore the graph from each vertex that hasn’t been visited yet, finding all vertices that are part of the same cluster. Each time you find a new cluster, add it to your list of subgraphs. This way, you’ll end up with a list of all the separate clusters in the graph.
Hint: We recommend using the python’s set() built-in.
3. Shortest path (Breadth-First-Search)
Find the shortest path connecting two users in the network using BFS (with path tracking).
shortest_path()
When dealing with graphs we often want to determine the shortest path connecting two nodes. In terms of weighted graphs, the well-known dijkstra algorithm is often used. However, in our personal network we deal with an unweighted graph, where edges don’t contain a weight. For identifying the shortest path in an unweighted graph the breadth-first-search (BFS) algorithm with a slight extension, i.e. path tracking, is sufficient. Path-tracking lets you maintaining information about how each vertex was reached from the source vertex. The method takes two arguments, a ‘start’ vertex and an ‘end’ vertex. The function should return a vertex list with all the vertices belonging to the identified shortest path including the start and end vertices. So take once again our starting point Mark and the end vertex Jack the shortest path should look like this:
['Mark', 'Sundar', 'Jack']
4. Most influential users (Closeness)
Next we want you to identify the most influential users in our network of followers. There are many interpretations of influence and even more techniques to calculate them. In this task we determine the degree of influence based on a “Closeness” measure which is defined below. By calculating the “Closeness” measure for every node we can additionally answer one of the most respected questions in network theory researched by Milgram et al as the Small-world experiment “On average, through how many corners are you connected to every other person in the network?” This task requires you to have a working method for shortest path identification.
Closeness: average length of the shortest paths between that node and all other nodes in the graph
most_influential()
This method does not need any argument .We expect your implementation to return a return a list of tuples containing all users who have the same minimum average shortest path length. The first element of each tupel should be the user and the second element be the avarage length of the shortest paths connecting that node to other nodes. If there is only one distinctive most influential user, the list therefore should contain only one tuple with the user and the distance. Be sure to include the start and end vertex in the shortest path length, e.g. for the above displayed shortest path between Mark and Jack you should count 3. As long as your implementation of “most_influential()” returns the correct tuple any implementation is fine. However we also included a proposal for a pseudo-code within the distribution code skeleton.
5. Community detection (Betweenness)
Finally, we want to detect communities within the network using the Girvan Newman Algorithm which requires you to calculate a “Betweenness”-measure for your network edges.
Betweenness: Number of shortest paths from all nodes to all others that pass through a particular edge.
Girvan Newman Algorithm: steps for community detection:
1. The betweenness of all existing edges in the network is calculated first.
2. The edge(s) with the highest betweenness are removed.
3. The betweenness of all edges affected by the removal is recalculated.
4. Steps 2 and 3 are repeated until the desired amount of clusters are identified or no edges remain.
This is the most comprehensive task. We therefore divided it into 4 auxiliary functions which will be arranged respectively in the girvan_newman_algorithm()-method.
get_subgraphs():
Nothing to do here as we simply use our implementation from above
edge_in_sp():
This method takes in an edge and a shortest path and checks if the edge is present or not. If you wonder how to depict an edge, we recommend you to pass a tuple containing both connecting vertices to the method. The return type of that method should be a boolean variable.
compute_shortest_paths():
As we need to recalculate the shortest paths between nodes after an edge got removed, we need a method that does just this.
This method therefore computes all possible shortest paths within the network and stores/updates them in self.sps.
The self.sps attribute can be used as a two-dimensional array (matrix). This method does not need to return anything
as information is transferred by the update of an object attribute.
edge_to_remove():
Here we are in the heart of the algorithm where the edge betweenness is calculated. By comparing the betweenness measure among all present edges you should identify the edge with the highest measure and return it. Like that it can be removed in a subsequent step.
girvan_newman_algorithm():
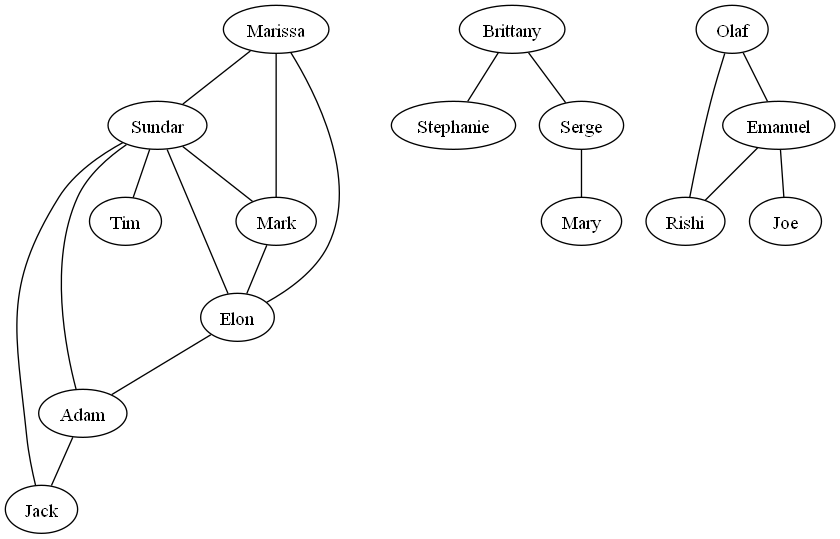
Now that we have all of the individual parts ready, we can assemble them in this method accordingly. The pseudo-code should help you in determining the order of steps.
For our example, if we want to identify the 3 most apparent clusters within the network, we would yield the following:
check50
To check your program you can run this line in your terminal.
check50 fau-is/IntroCS/Mastodon_GT/Mastodon_network
submit50
To submit your program use this line of code.
submit50 fau-is/IntroCS/Mastodon_GT/Mastodon_network